Global Oil and gas Corporate deals back to historic levels around 45%, down from 2009 high
Corporate deals as a share of the total was 45% in 2010, closer to the historic range 34-37% in 2007-2008 than 2009 at 74% (64% without the XOM-XTO deal).

Trades involving partial company stakes accounted for 16% of total Global M&A activity in 2010
The total value of trade involving partial company stakes in 2010 was $33bn, whereas the total deal value for such deals put together for previous three years (2009, 2008 & 2007) was only $5.2bn. Main contributors to that figure was from 2 deals: OMV selling 21% stake in MOL to Surgutneftegas for $1.9bn (2009); and Repsol YPF divesting part of its stake in the YPF unit to Petersen Group for $2.2bn (2007).

For more details look at http://www.derrickpetroleum.com/reports1.html
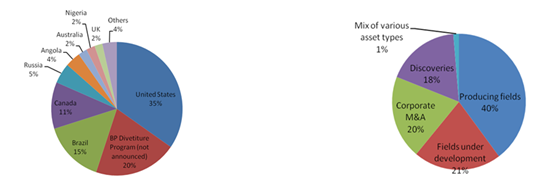
We have also recently published a report for E&P Business Development and New Ventures professionals working on deals globally. This report provides information on $93 billion of global oil and gas assets on the market.
The report provides details on ~500 opportunities:
- Assets for sale
- Corporate M&A opportunities
- JV opportunities
- Exploration farm-ins
You can view a sample copy of this report at http://www.derrickpetroleum.com/reports2.html